The simple 2 step process for quickly debugging automation code – IntelliJ

I have been writing automation code for a while now. I have used various editors and tools. The best editor I have used thus far is IntelliJ. I really like the simplicity of the editor.
Anyways, I wanted to quickly share a 2 step process in IntelliJ which I have used to quickly debug automation code. This has helped me troubleshoot countless problems over the past several years. Here it goes…
Step 1- The primitive “Print” statements
I am still old school and love giving print statements to see what values the variables are holding at different steps of my code. I like visually seeing this in my console output while running my program. This is especially helpful when you have complex loops, arrays; where you need to loop through multiple elements to locate a child node and get text, id etc.
Step 2-Using “F7” (Step Into) and “F8” (Step Over) keys to step through code
Apart from print statements, I also use IntelliJ’s features to run the program in debug mode and then use the “F7” and “F8” keys to either Step Into a method or Step Over to the next line after the method respectively.
This link gives more clarity on the differences between the 2 options –https://stackoverflow.com/questions/3580715/what-is-the-difference-between-step-into-and-step-over-in-the-eclipse-debugger (Yes it is related to eclipse but hold good for IntelliJ as well)
So the way you will debug your code is-
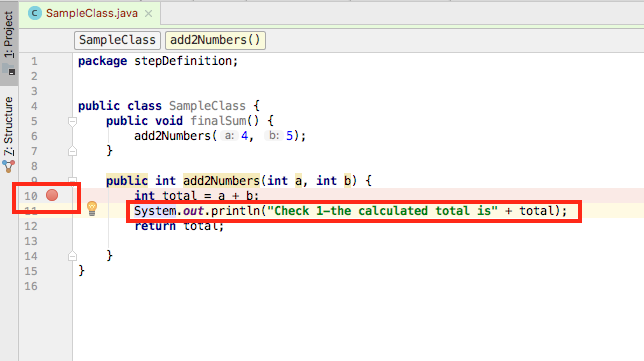
Set a break point at different sections of the code just by clicking on the side next to the line number (at the line of code you want to debug) as shown in the below screenshot
Go to Run-> Debug from the tool bar in IntelliJ (As shown in the below screen shot)

Then, when the program starts running in the debug mode it will automatically stop at the point you set the break point at and then use the shortcut keys to inspect the line further
There you have it, the simple 2 step process for debugging automation code in your IntelliJ editor. For more references, refer to the below links and hopefully you find this post helpful https://www.jetbrains.com/help/idea/starting-the-debugger-session.htmlhttps://www.jetbrains.com/help/idea/creating-line-breakpoints.htmlhttps://www.youtube.com/watch?v=w7W9kDgHP2k
If you have any other tips/tricks, feel free to share it in the comments below or let me know by contacting me here-> http://www.rajsubra.com/contact/